
Page 130 - eBook_Proceedings of the International Conference on Digital Manufacturing V2
P. 130
Proceedings of the International Conference on Digital Manufacturing –
Volume 2
panel as compared to fixed panels. This is shown with the
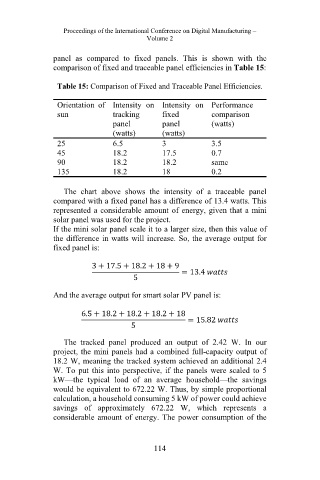
comparison of fixed and traceable panel efficiencies in Table 15:
Table 15: Comparison of Fixed and Traceable Panel Efficiencies.
Orientation of Intensity on Intensity on Performance
sun tracking fixed comparison
panel panel (watts)
(watts) (watts)
25 6.5 3 3.5
45 18.2 17.5 0.7
90 18.2 18.2 same
135 18.2 18 0.2
The chart above shows the intensity of a traceable panel
compared with a fixed panel has a difference of 13.4 watts. This
represented a considerable amount of energy, given that a mini
solar panel was used for the project.
If the mini solar panel scale it to a larger size, then this value of
the difference in watts will increase. So, the average output for
fixed panel is:
3 + 17.5 + 18.2 + 18 + 9
= 13.4
5
And the average output for smart solar PV panel is:
6.5 + 18.2 + 18.2 + 18.2 + 18
= 15.82
5
The tracked panel produced an output of 2.42 W. In our
project, the mini panels had a combined full-capacity output of
18.2 W, meaning the tracked system achieved an additional 2.4
W. To put this into perspective, if the panels were scaled to 5
kW—the typical load of an average household—the savings
would be equivalent to 672.22 W. Thus, by simple proportional
calculation, a household consuming 5 kW of power could achieve
savings of approximately 672.22 W, which represents a
considerable amount of energy. The power consumption of the
114