
Page 25 - eBook_Proceedings of the International Conference on Digital Manufacturing V1
P. 25
Degradation Analysis of 3D Printed PLA in Simulated Body
behaviour, leading to the observed acceleration phases during
specific intervals.
0.5 0.3617 0.3903
Weight Different Percentage (%) 0.3 Day 0 Day 7 0.1473 Day 14 Day 21 0.3113 Day 28
0.4
0.3610
0.2944
0.2458
0.2434
0.2366
0.2338
0.1821
0.2
0.1825
0.1
0 0 0
0
Cube Time Interval Bar
Dogbone
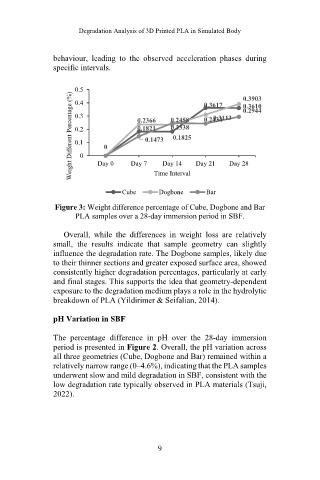
Figure 3: Weight difference percentage of Cube, Dogbone and Bar
PLA samples over a 28-day immersion period in SBF.
Overall, while the differences in weight loss are relatively
small, the results indicate that sample geometry can slightly
influence the degradation rate. The Dogbone samples, likely due
to their thinner sections and greater exposed surface area, showed
consistently higher degradation percentages, particularly at early
and final stages. This supports the idea that geometry-dependent
exposure to the degradation medium plays a role in the hydrolytic
breakdown of PLA (Yildirimer & Seifalian, 2014).
pH Variation in SBF
The percentage difference in pH over the 28-day immersion
period is presented in Figure 2. Overall, the pH variation across
all three geometries (Cube, Dogbone and Bar) remained within a
relatively narrow range (0–4.6%), indicating that the PLA samples
underwent slow and mild degradation in SBF, consistent with the
low degradation rate typically observed in PLA materials (Tsuji,
2022).
9