
Page 76 - eBook_Proceedings of the International Conference on Digital Manufacturing V1
P. 76
Proceedings of the International Conference on Digital Manufacturing –
Volume 1
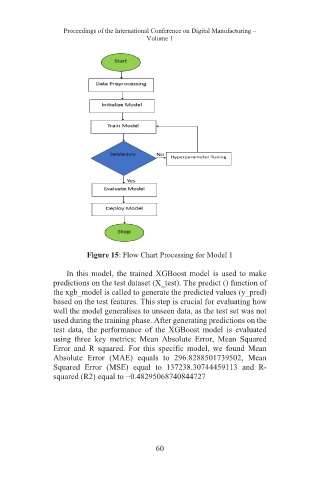
Figure 15: Flow Chart Processing for Model 1
In this model, the trained XGBoost model is used to make
predictions on the test dataset (X_test). The predict () function of
the xgb_model is called to generate the predicted values (y_pred)
based on the test features. This step is crucial for evaluating how
well the model generalises to unseen data, as the test set was not
used during the training phase. After generating predictions on the
test data, the performance of the XGBoost model is evaluated
using three key metrics; Mean Absolute Error, Mean Squared
Error and R squared. For this specific model, we found Mean
Absolute Error (MAE) equals to 296.8288501739502, Mean
Squared Error (MSE) equal to 137238.30744459113 and R-
squared (R2) equal to −0.48295068740844727
60