
Page 80 - eBook_Proceedings of the International Conference on Digital Manufacturing V1
P. 80
Proceedings of the International Conference on Digital Manufacturing –
Volume 1
Model 3
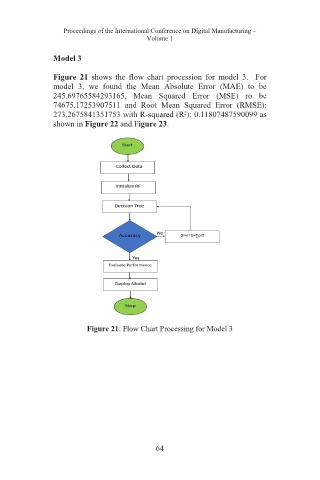
Figure 21 shows the flow chart procession for model 3. For
model 3, we found the Mean Absolute Error (MAE) to be
245.69765584293165, Mean Squared Error (MSE) ro be
74675.17253907511 and Root Mean Squared Error (RMSE):
273.2675841351753 with R-squared (R²): 0.11807487590099 as
shown in Figure 22 and Figure 23.
Figure 21: Flow Chart Processing for Model 3
64