
Page 81 - eBook_Proceedings of the International Conference on Digital Manufacturing V1
P. 81
Leveraging Machine Learning to Enhance Supply Chain Agility and Strategic
Operational Excellence
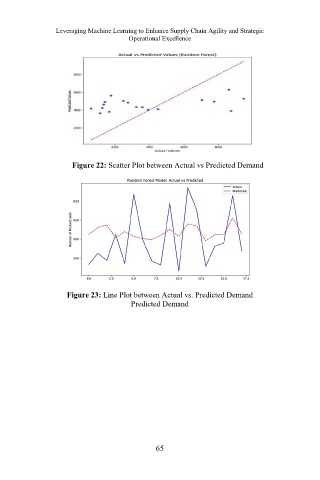
Figure 22: Scatter Plot between Actual vs Predicted Demand
Figure 23: Line Plot between Actual vs. Predicted Demand
Predicted Demand
65