
Page 77 - eBook_Proceedings of the International Conference on Digital Manufacturing V1
P. 77
Leveraging Machine Learning to Enhance Supply Chain Agility and Strategic
Operational Excellence
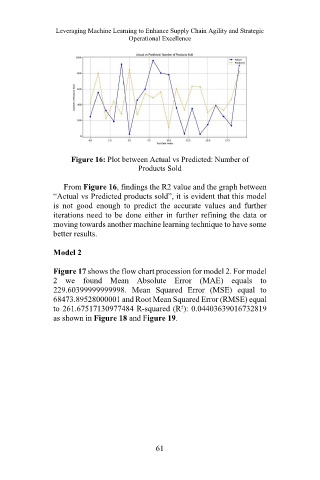
Figure 16: Plot between Actual vs Predicted: Number of
Products Sold
From Figure 16, findings the R2 value and the graph between
“Actual vs Predicted products sold”, it is evident that this model
is not good enough to predict the accurate values and further
iterations need to be done either in further refining the data or
moving towards another machine learning technique to have some
better results.
Model 2
Figure 17 shows the flow chart procession for model 2. For model
2 we found Mean Absolute Error (MAE) equals to
229.60399999999998. Mean Squared Error (MSE) equal to
68473.89528000001 and Root Mean Squared Error (RMSE) equal
to 261.67517130977484 R-squared (R²): 0.04403639016732819
as shown in Figure 18 and Figure 19.
61