
Page 82 - eBook_Proceedings of the International Conference on Digital Manufacturing V1
P. 82
Proceedings of the International Conference on Digital Manufacturing –
Volume 1
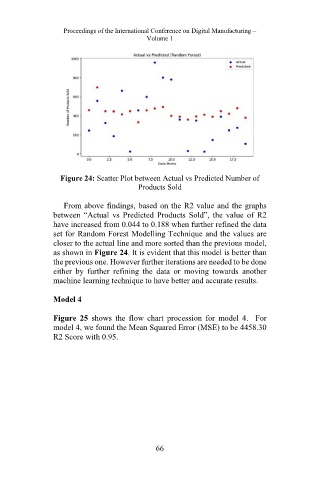
Figure 24: Scatter Plot between Actual vs Predicted Number of
Products Sold
From above findings, based on the R2 value and the graphs
between “Actual vs Predicted Products Sold”, the value of R2
have increased from 0.044 to 0.188 when further refined the data
set for Random Forest Modelling Technique and the values are
closer to the actual line and more sorted than the previous model,
as shown in Figure 24. It is evident that this model is better than
the previous one. However further iterations are needed to be done
either by further refining the data or moving towards another
machine learning technique to have better and accurate results.
Model 4
Figure 25 shows the flow chart procession for model 4. For
model 4, we found the Mean Squared Error (MSE) to be 4458.30
R2 Score with 0.95.
66