
Page 83 - eBook_Proceedings of the International Conference on Digital Manufacturing V1
P. 83
Leveraging Machine Learning to Enhance Supply Chain Agility and Strategic
Operational Excellence
Figure 25: Flow Chart Processing for Model 4
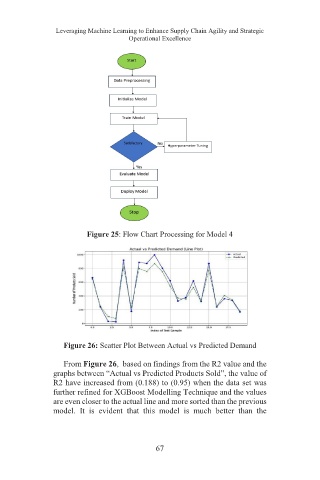
Figure 26: Scatter Plot Between Actual vs Predicted Demand
From Figure 26, based on findings from the R2 value and the
graphs between “Actual vs Predicted Products Sold”, the value of
R2 have increased from (0.188) to (0.95) when the data set was
further refined for XGBoost Modelling Technique and the values
are even closer to the actual line and more sorted than the previous
model. It is evident that this model is much better than the
67