
Page 84 - eBook_Proceedings of the International Conference on Digital Manufacturing V1
P. 84
Proceedings of the International Conference on Digital Manufacturing –
Volume 1
previous three. Hence, this model is the best amongst all the
models for this dataset.
Model 5
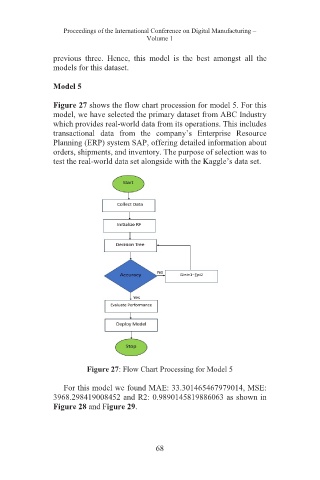
Figure 27 shows the flow chart procession for model 5. For this
model, we have selected the primary dataset from ABC Industry
which provides real-world data from its operations. This includes
transactional data from the company’s Enterprise Resource
Planning (ERP) system SAP, offering detailed information about
orders, shipments, and inventory. The purpose of selection was to
test the real-world data set alongside with the Kaggle’s data set.
Figure 27: Flow Chart Processing for Model 5
For this model we found MAE: 33.301465467979014, MSE:
3968.298419008452 and R2: 0.9890145819886063 as shown in
Figure 28 and Figure 29.
68