
Page 85 - eBook_Proceedings of the International Conference on Digital Manufacturing V1
P. 85
Leveraging Machine Learning to Enhance Supply Chain Agility and Strategic
Operational Excellence
Figure 28: Scatter Plot between Actual vs. Predicted Demand
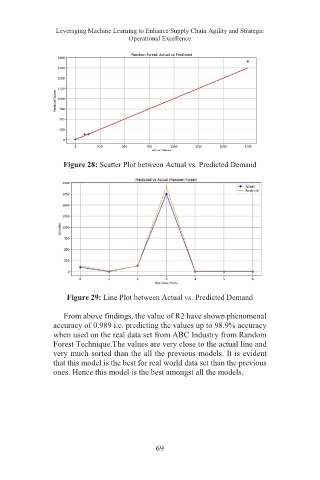
Figure 29: Line Plot between Actual vs. Predicted Demand
From above findings, the value of R2 have shown phenomenal
accuracy of 0.989 i.e. predicting the values up to 98.9% accuracy
when used on the real data set from ABC Industry from Random
Forest Technique.The values are very close to the actual line and
very much sorted than the all the previous models. It is evident
that this model is the best for real world data set than the previous
ones. Hence this model is the best amongst all the models.
69