
Page 36 - eBook_Proceedings of the International Conference on Digital Manufacturing V2
P. 36
Proceedings of the International Conference on Digital Manufacturing –
Volume 2
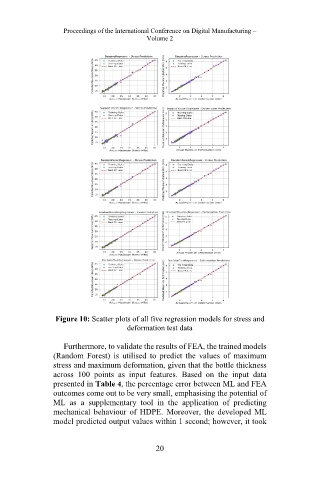
Figure 10: Scatter plots of all five regression models for stress and
deformation test data
Furthermore, to validate the results of FEA, the trained models
(Random Forest) is utilised to predict the values of maximum
stress and maximum deformation, given that the bottle thickness
across 100 points as input features. Based on the input data
presented in Table 4, the percentage error between ML and FEA
outcomes come out to be very small, emphasising the potential of
ML as a supplementary tool in the application of predicting
mechanical behaviour of HDPE. Moreover, the developed ML
model predicted output values within 1 second; however, it took
20