
Page 32 - eBook_Proceedings of the International Conference on Digital Manufacturing V2
P. 32
Proceedings of the International Conference on Digital Manufacturing –
Volume 2
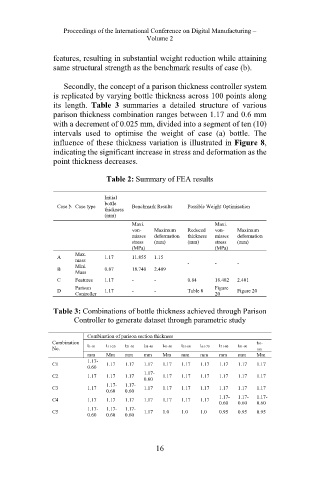
features, resulting in substantial weight reduction while attaining
same structural strength as the benchmark results of case (b).
Secondly, the concept of a parison thickness controller system
is replicated by varying bottle thickness across 100 points along
its length. Table 3 summaries a detailed structure of various
parison thickness combination ranges between 1.17 and 0.6 mm
with a decrement of 0.025 mm, divided into a segment of ten (10)
intervals used to optimise the weight of case (a) bottle. The
influence of these thickness variation is illustrated in Figure 8,
indicating the significant increase in stress and deformation as the
point thickness decreases.
Table 2: Summary of FEA results
Initial
bottle
Case N Case type Benchmark Results Possible Weight Optimisation
thickness
(mm)
Maxi. Maxi.
von- Maximum Reduced von- Maximum
misses deformation thickness misses deformation
stress (mm) (mm) stress (mm)
(MPa) (MPa)
Max.
A mass 1.17 11.855 1.15 - - -
B Mini. 0.87 18.740 2.409
Mass
C Features 1.17 - - 0.84 18.482 2.401
Parison Figure
D 1.17 - - Table 8 Figure 20
Controller 20
Table 3: Combinations of bottle thickness achieved through Parison
Controller to generate dataset through parametric study
Combination of parison section thickness
Combination t1-10 t11-20 t21-30 t31-40 t41-50 t51-60 t61-70 t71-80 t81-90 t91-
No. 100
mm Mm mm mm Mm mm mm mm mm Mm
1.17-
C1 1.17 1.17 1.17 1.17 1.17 1.17 1.17 1.17 1.17
0.60
1.17-
C2 1.17 1.17 1.17 1.17 1.17 1.17 1.17 1.17 1.17
0.60
1.17- 1.17-
C3 1.17 1.17 1.17 1.17 1.17 1.17 1.17 1.17
0.60 0.60
1.17- 1.17- 1.17-
C4 1.17 1.17 1.17 1.17 1.17 1.17 1.17
0.60 0.60 0.60
1.17- 1.17- 1.17-
C5 1.17 1.0 1.0 1.0 0.95 0.95 0.95
0.60 0.60 0.60
16