
Page 34 - eBook_Proceedings of the International Conference on Digital Manufacturing V2
P. 34
Proceedings of the International Conference on Digital Manufacturing –
Volume 2
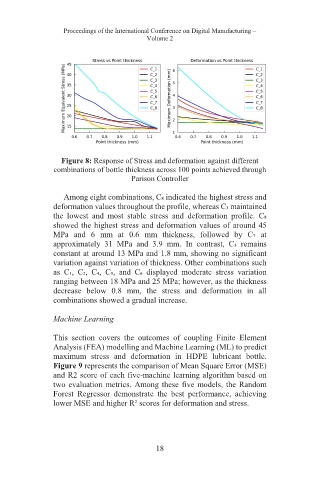
Figure 8: Response of Stress and deformation against different
combinations of bottle thickness across 100 points achieved through
Parison Controller
Among eight combinations, C₈ indicated the highest stress and
deformation values throughout the profile, whereas C₃ maintained
the lowest and most stable stress and deformation profile. C₈
showed the highest stress and deformation values of around 45
MPa and 6 mm at 0.6 mm thickness, followed by C₇ at
approximately 31 MPa and 3.9 mm. In contrast, C₃ remains
constant at around 13 MPa and 1.8 mm, showing no significant
variation against variation of thickness. Other combinations such
as C₁, C₂, C₄, C₅, and C₆ displayed moderate stress variation
ranging between 18 MPa and 25 MPa; however, as the thickness
decrease below 0.8 mm, the stress and deformation in all
combinations showed a gradual increase.
Machine Learning
This section covers the outcomes of coupling Finite Element
Analysis (FEA) modelling and Machine Learning (ML) to predict
maximum stress and deformation in HDPE lubricant bottle.
Figure 9 represents the comparison of Mean Square Error (MSE)
and R2 score of each five-machine learning algorithm based on
two evaluation metrics. Among these five models, the Random
Forest Regressor demonstrate the best performance, achieving
lower MSE and higher R² scores for deformation and stress.
18