
Page 35 - eBook_Proceedings of the International Conference on Digital Manufacturing V2
P. 35
Collaborative Study on Weight Optimisation of Lubricant Bottles under
Stacking Condition using Finite Element Analysis and Machine Learning
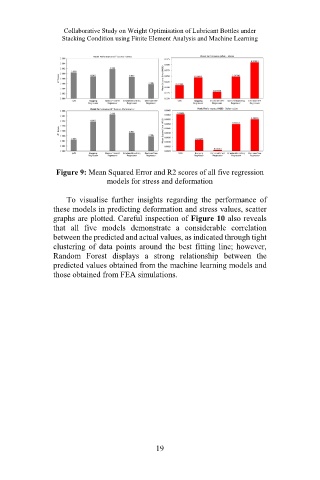
Figure 9: Mean Squared Error and R2 scores of all five regression
models for stress and deformation
To visualise further insights regarding the performance of
these models in predicting deformation and stress values, scatter
graphs are plotted. Careful inspection of Figure 10 also reveals
that all five models demonstrate a considerable correlation
between the predicted and actual values, as indicated through tight
clustering of data points around the best fitting line; however,
Random Forest displays a strong relationship between the
predicted values obtained from the machine learning models and
those obtained from FEA simulations.
19