
Page 26 - eBook_Proceedings of the International Conference on Digital Manufacturing V2
P. 26
Proceedings of the International Conference on Digital Manufacturing –
Volume 2
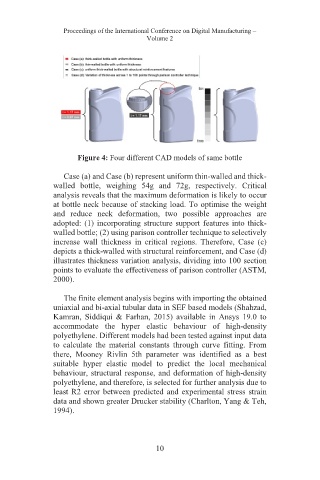
Figure 4: Four different CAD models of same bottle
Case (a) and Case (b) represent uniform thin-walled and thick-
walled bottle, weighing 54g and 72g, respectively. Critical
analysis reveals that the maximum deformation is likely to occur
at bottle neck because of stacking load. To optimise the weight
and reduce neck deformation, two possible approaches are
adopted: (1) incorporating structure support features into thick-
walled bottle; (2) using parison controller technique to selectively
increase wall thickness in critical regions. Therefore, Case (c)
depicts a thick-walled with structural reinforcement, and Case (d)
illustrates thickness variation analysis, dividing into 100 section
points to evaluate the effectiveness of parison controller (ASTM,
2000).
The finite element analysis begins with importing the obtained
uniaxial and bi-axial tubular data in SEF based models (Shahzad,
Kamran, Siddiqui & Farhan, 2015) available in Ansys 19.0 to
accommodate the hyper elastic behaviour of high-density
polyethylene. Different models had been tested against input data
to calculate the material constants through curve fitting. From
there, Mooney Rivlin 5th parameter was identified as a best
suitable hyper elastic model to predict the local mechanical
behaviour, structural response, and deformation of high-density
polyethylene, and therefore, is selected for further analysis due to
least R2 error between predicted and experimental stress strain
data and shown greater Drucker stability (Charlton, Yang & Teh,
1994).
10